






How to Monitor Errors and Downtime in Your AI-Built App
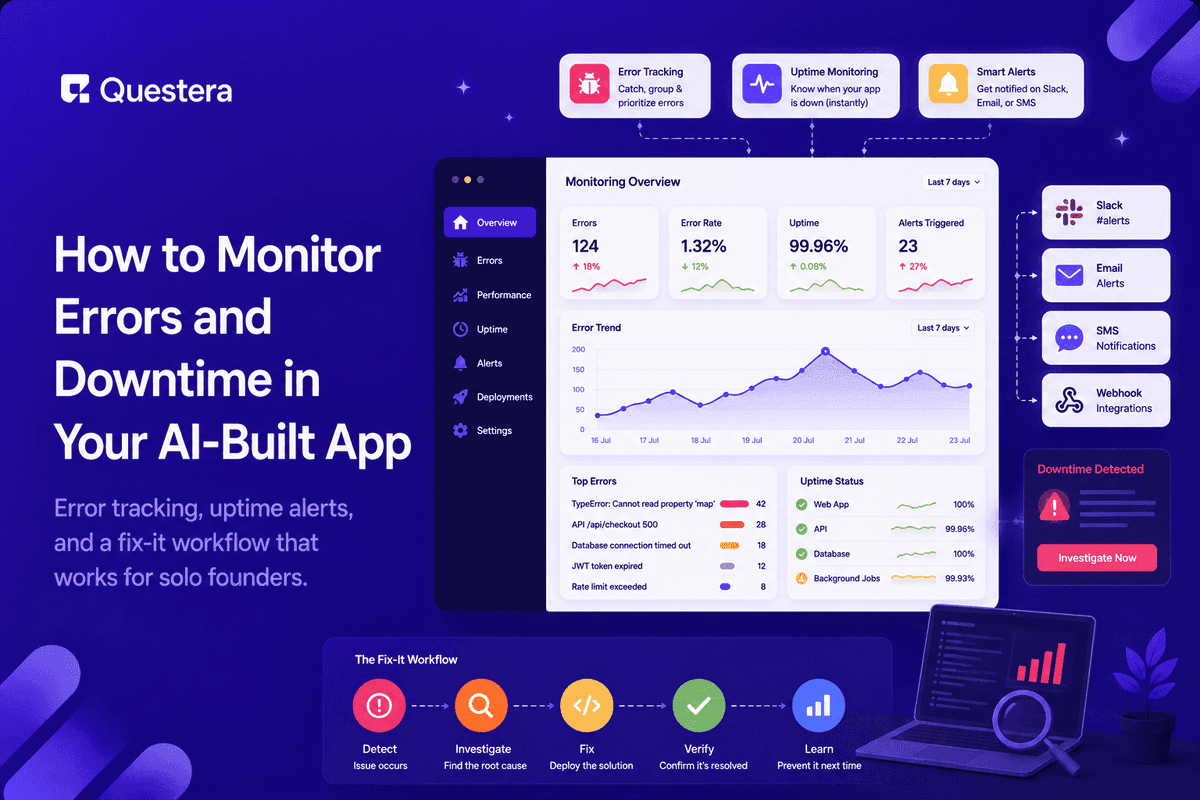
To monitor errors and downtime in an AI-built app, you need two layers: an error tracker that captures crashes with enough context to fix them, and an uptime check that pings your app every few minutes and alerts you when it's down. Both take under an hour to set up on free tiers — and they're the difference between hearing about problems from a dashboard or from an angry user.
Without monitoring, your effective alert system is users emailing "it's broken" — usually hours after the breakage started, usually with no detail you can act on, and only from the small minority of users who bother to write instead of leaving. For every user who reports a bug, several more just close the tab.
This guide covers what actually breaks after launch, how to set up both layers without alert fatigue, a realistic fix-it workflow for one person, and when to go beyond the basics.
What Can Actually Go Wrong After Launch?
AI-built apps fail the same ways all apps fail — the difference is that a non-technical founder often has no window into any of it until monitoring is in place. The usual suspects:
- A third-party API you depend on changes, rate-limits you, or goes down — and your app inherits the outage.
- An edge case your testing never hit crashes a core flow for some users but not others.
- A database hits a limit — storage, connections, or a query that was fine at 100 rows and is slow at 100,000.
- An expired key, certificate, or failed payment on a service you forgot silently kills a feature.
- A change you shipped breaks something unrelated that nobody clicks for days.
Notice that most of these aren't caused by anything you did that week. That's what makes monitoring non-optional: a healthy app can stop being healthy while you're asleep, and the only variable you control is how fast you find out.
How Do You Track Errors Without Drowning in Alerts?
Add an error tracking service and let it group repeated errors into single issues — a thousand copies of one crash should be one notification, not a thousand. Grouping is the feature that makes error tracking usable by one person; without it you'd mute the channel within a week.
Then set severity rules: crashes in signup or payment flows page you immediately; cosmetic errors get reviewed in a weekly sweep. If every alert feels urgent, you'll stop reading all of them — alert fatigue kills more monitoring setups than missing tools do.
| Monitoring Layer | What It Catches | Typical Setup |
|---|---|---|
| Error tracking (e.g. Sentry) | Crashes and exceptions, grouped, with stack traces | Add the SDK snippet and set alert rules for critical flows |
| Uptime checks (e.g. UptimeRobot, Better Stack) | Your app or API being unreachable | Ping key URLs every 1–5 minutes with email or push alerts |
| Logs | The story around a failure — what happened before and after | Keep server logs searchable; check when investigating |
| Status page | Nothing — but it tells users you know and are on it | Free tier of an uptime tool, linked from your app footer |
How Do You Monitor Uptime and Catch Downtime First?
Point an uptime monitor at three URLs: your landing page, your app's main URL, and — most importantly — a health-check endpoint that touches the database. The last one matters because "up" is not binary: a server happily serving a login page in front of a dead database is down in every way users care about, and a homepage ping will never notice.
Route alerts somewhere you'll actually see them at night if your users span time zones — push notification or SMS, not just email. And set a sensible check interval: every one to five minutes is plenty; the goal is that you find out about downtime before your users tell you, not sub-second detection.
What's a Realistic Fix-It Workflow for a Solo Founder?
- Alert fires — open the error tracker and read the grouped issue: how many users, which flow, since when.
- Decide severity honestly: broken payments is now; a misaligned button is the weekly sweep.
- Reproduce it using the captured stack trace, user actions, and page.
- Paste the error context into your AI builder and ask it to diagnose and propose a fix.
- Verify the fix on the affected flow yourself, then deploy and watch the issue's event count drop to zero.
- Write one line in a running log: what broke, why, and what prevents a repeat.
That last step feels skippable and isn't. After a few months the log becomes a pattern-detector — the third incident caused by the same third-party API is an argument for replacing it, but only if you wrote down the first two.
Step-by-Step: Monitoring in Under an Hour
- Create a free account on an error tracking service and prompt your AI builder to add its SDK to your app.
- Ask the builder to wrap your API routes so server-side failures are captured with request context.
- Set two alert rules: instant notification for signup/payment flows, daily digest for everything else.
- Prompt the builder to add a /health endpoint that reads from the database and returns 200.
- Create a free uptime monitor pinging your main URL and the health endpoint every few minutes.
- Turn on the uptime tool's public status page and link it in your app's footer.
- Break something on purpose in a test environment and confirm the alert actually reaches your phone.
The last step is the one everyone skips: an unverified alert pipeline is a hope, not a system. Thirty seconds of deliberate breakage now beats discovering a misconfigured webhook during a real outage.
When Should You Add More Advanced Monitoring?
Once the basics are quiet and users grow: performance monitoring to spot endpoints getting slower before they become outages, and simple anomaly alerts on business metrics. Signups dropping to zero is monitoring too — and it often catches what error trackers can't, like a broken email verification service that fails without throwing anything.
Resist adding these on day one. Advanced dashboards you don't look at are noise, and the discipline of a small, fully-read monitoring setup beats a big, ignored one.
Common Mistakes to Avoid
- Relying on users to report problems instead of any monitoring at all.
- Alerting on everything equally until you tune out every notification.
- Watching only the homepage while the database-backed flows are broken.
- Never test-firing the alert pipeline, then learning during an outage that it was misconfigured.
- Fixing crashes without checking whether the same error keeps returning.
- Having no status page, so every incident becomes a support pile-up on top of a technical problem.
Frequently Asked Questions
What's the minimum monitoring setup worth having?
One error tracker with alerts on critical flows, plus one uptime check on your main URL. That's under an hour of setup on free tiers, and it covers the majority of real incidents an early-stage app will hit.
Want to try one of these? Start on Greta.sh — no setup, no boilerplate — just a prompt.Do monitoring tools cost money?
The standard tools all have free tiers that comfortably cover early-stage apps — error trackers typically include thousands of events per month free, and uptime monitors offer free checks at several-minute intervals. Cost is not a reason to skip this.
Can my AI builder set up monitoring for me?
Yes — prompt it to add the error tracking SDK, wrap API routes so failures are captured with context, and create a health-check endpoint that touches the database for your uptime monitor to ping. Creating accounts and alert rules stays with you.
How fast do I need to fix a reported error?
Triage by impact: payment and signup breakage now, core-flow bugs within a day, cosmetic issues in your weekly sweep. The point of monitoring isn't fixing everything instantly — it's knowing the impact so you choose deliberately.
What about downtime that isn't my fault, like a provider outage?
You still own the communication — post it on your status page and say you're monitoring the provider. Your uptime checks are how you know it's them and not you, which changes the message from panic to information.
What's the difference between error tracking and logging?
Error tracking is the alarm: it groups failures and notifies you with stack traces. Logs are the flight recorder: the running record you search to reconstruct what happened around a failure. You want both — the tracker tells you something broke, the logs tell you the story.
Should I monitor my app's business metrics too?
Yes, once technical basics are quiet. Signups dropping to zero for six hours is an incident even when no exception fired — a simple daily check or threshold alert on signups and payments catches the failures error trackers can't see.
Key Takeaways
- Two layers cover most incidents: grouped error tracking plus uptime checks — under an hour on free tiers.
- Alert loudly only on critical flows; everything else goes to a weekly review. Alert fatigue kills monitoring.
- Monitor a health endpoint that touches the database, not just the homepage.
- Test-fire your alerts once — an unverified pipeline is a hope, not a system.
- Feed captured error context to your AI builder to speed up every fix, and keep a one-line incident log.
- A status page turns downtime from a support flood into one calm update.
Launching soon? Prompt Greta to add a health-check endpoint and wire in error tracking while it builds — so the day something breaks, you already know.





© 2026 Questera
Follow in Google