


How to A/B Test Your AI-Built Landing Page
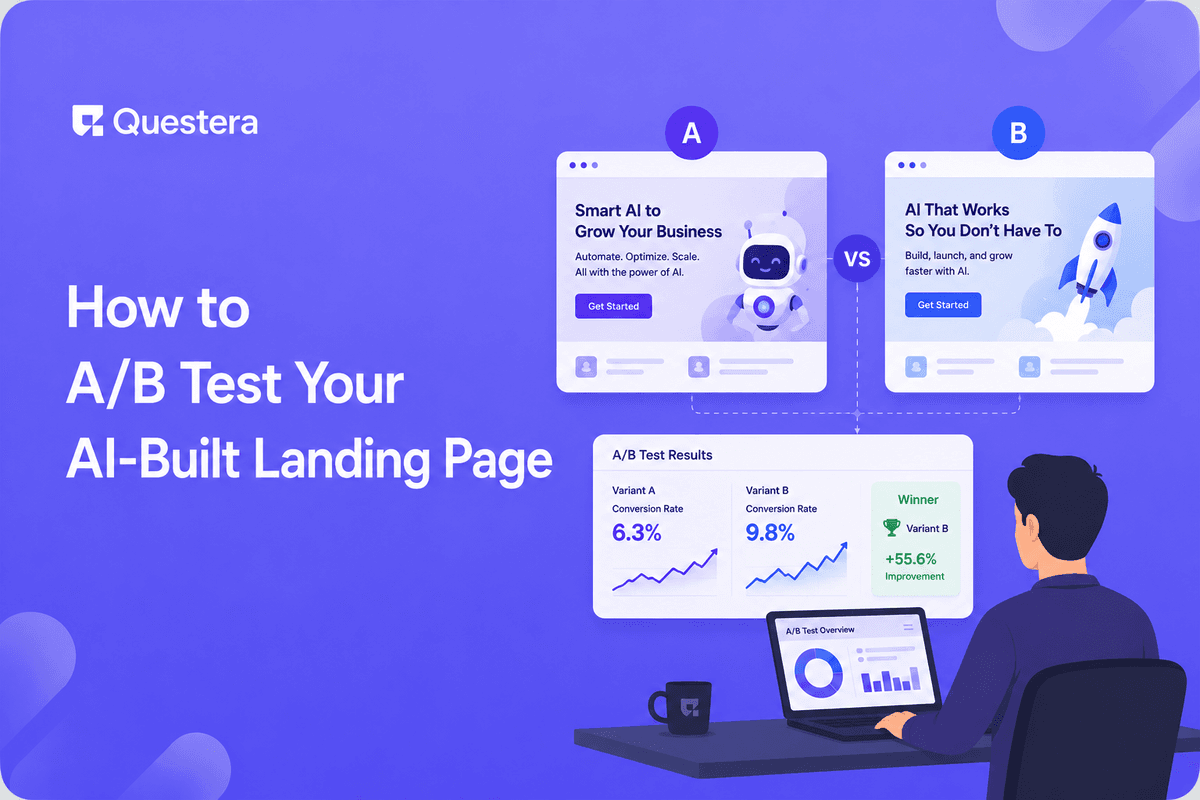
A/B testing your landing page is the cheapest growth lever you have — assuming you do it right. Most indie SaaS founders test the wrong things (button colors, tiny copy tweaks) and get noise. The tests that actually move conversion: headline variants, value proposition framing, target audience callout, social proof placement, primary CTA copy, pricing presentation. This guide covers what to test, how much traffic you need for statistical significance, the tools that work at indie scale (PostHog feature flags, GrowthBook, Vercel Edge Config), and the methodology that produces real signal vs noise.
A/B testing is one of the highest-leverage growth practices, and one of the most commonly mis-applied. Indie SaaS founders read 'always be testing' advice, run tests on button colors, get no significant results after 4 weeks, and conclude A/B testing doesn't work at small scale. The conclusion is wrong; the methodology was wrong. Testing trivial things at low traffic produces noise; testing important things at sufficient traffic produces real growth.
Got an idea? Build it now!
Just start with a simple Prompt
Get Started Today


Why Most Landing Page A/B Tests Fail
- Testing trivial changes — Button colors, font sizes, minor copy tweaks rarely produce measurable lifts
- Insufficient traffic — Tests need adequate sample sizes; running on 200 visitors produces noise
- Running too long — Tests interpreted prematurely without statistical significance
- Calling winners on small differences — '8% better' with 100 samples is noise
- Testing multiple variables at once — Can't isolate which change drove the effect
- Stopping tests early when one variant looks ahead — Statistical malpractice
- Not having a clear hypothesis — Testing without theory produces random results
What's Worth A/B Testing
Tier 1 — Highest Impact (Test These First)
- Headline (the main message above the fold)
- Value proposition framing (outcome-focused vs feature-focused)
- Target audience callout ('For solo lawyers' vs 'For professionals')
- Primary CTA copy ('Get Started Free' vs 'Start Building' vs 'Try It Now')
- Pricing presentation (visible upfront vs gated behind 'see pricing')
- Hero visual (product screenshot vs founder photo vs lifestyle image)
- Social proof placement (above vs below the fold)
Tier 2 — Worth Testing Once Tier 1 Is Optimized
- Page length (short vs long)
- FAQ presence and placement
- Number of testimonials shown
- Pricing tier order (best plan featured vs middle plan featured)
- Form fields (just email vs email + company)
- Trust signals (security badges, customer logos)
- Founder credibility line presence
Tier 3 — Skip Until You Have Major Scale
- Button colors
- Font choices (within reason)
- Minor word swaps in body copy
- Section ordering when content is similar
- Image styling variations
- Footer variations
Statistical Significance Basics
Statistical significance means the difference between variants is unlikely to be due to chance. The standard threshold is 95% confidence (p-value less than 0.05) — meaning there's less than 5% chance the observed difference is random noise.
| Baseline Conversion | Effect Size to Detect | Sample Per Variant |
|---|---|---|
| 5% | 20% lift (5% → 6%) | ~7,200 visitors |
| 5% | 50% lift (5% → 7.5%) | ~1,200 visitors |
| 5% | 100% lift (5% → 10%) | ~310 visitors |
| 10% | 20% lift (10% → 12%) | ~4,000 visitors |
| 10% | 50% lift (10% → 15%) | ~700 visitors |
| 20% | 20% lift (20% → 24%) | ~1,900 visitors |
Honest implication: at 1K visitors/month, you can only detect large effects (50%+ lift). Testing small changes at this scale is impossible to do with statistical rigor. Test big changes, accept large effect detection only, or aggregate traffic over months.
Calculating Significance
- Use online calculators (Optimizely, Evan Miller's calculator, or built into testing tools)
- Don't peek and call winners early — bias toward false positives
- Run until you've reached planned sample size, then decide
- Pre-register your hypothesis and stopping criteria (informally is fine)
Got an idea? Build it now!
Just start with a simple Prompt
Get Started Today
A/B Testing Tools for AI-Built Landing Pages
PostHog Feature Flags
- Built into PostHog (which you likely have for product analytics)
- Feature flags can route users to variants
- Bundled with conversion tracking
- Free tier covers indie SaaS scale
- Setup: 30 minutes
- Best for: full-funnel testing (visitor → conversion → activation)
GrowthBook
- Open-source A/B testing platform
- Strong statistical analysis (Bayesian and frequentist)
- Integrates with existing analytics (Mixpanel, GA, PostHog, BigQuery)
- Self-host or cloud (free tier)
- Best for: teams that want serious statistical analysis
Vercel Edge Config + Custom Routing
- Use Edge Config to define variants
- Route traffic via middleware
- Track conversions via your existing analytics
- Most flexible; requires more setup
- Best for: technical teams wanting full control
The Methodology That Works
Step 1: Establish Baseline
- Measure current conversion rate for at least 2 weeks
- Note traffic source breakdown (organic vs paid vs referral converts differently)
- Identify the metric that matters (visitor-to-signup, signup-to-paid, etc.)
- Track that single metric throughout testing
Step 2: Form Clear Hypothesis
Hypothesis format: 'I believe [variant] will [increase/decrease] [metric] because [reasoning]'. Example: 'I believe outcome-focused headline will increase signup rate vs feature-focused headline because outcome resonates with the target audience's actual job-to-be-done.' Hypothesis forces you to think about what you're testing and why.
Step 3: Design Exactly Two Variants
- Control (current) and variant (challenger)
- Change ONE thing at a time
- Make the change meaningful — not 'Get Started' vs 'Get Started!'
- Document the change clearly
Step 4: Calculate Required Sample Size
- Estimate baseline conversion rate
- Decide minimum effect size you care about
- Use a sample size calculator
- If required sample exceeds 4–8 weeks of traffic, the test isn't feasible at your scale
Step 5: Run the Test
- 50/50 traffic split (most common)
- Don't peek and stop early
- Track results but don't act on partial data
- Run until planned sample size is reached
Step 6: Analyze and Decide
- Calculate statistical significance
- If significant: ship the winner
- If not significant: ship control (don't ship variant on noise result)
- Document what you tested and the result for institutional memory
Got an idea? Build it now!
Just start with a simple Prompt
Get Started Today
Hypothesis Examples That Work
- 'Specific target audience callout ("For solo lawyers") will increase conversion vs generic ("For professionals") because specificity disqualifies the wrong audience and confirms the right audience.'
- 'Outcome-focused headline ("Get to inbox zero") will increase conversion vs feature-focused ("AI-powered email assistant") because customers buy outcomes, not features.'
- 'Visible pricing on landing page will increase signup-to-paid conversion vs gated pricing because qualified prospects self-select earlier.'
- 'Customer count signal ("Trusted by 2,400 designers") will increase conversion vs no count because social proof reduces decision risk.'
- 'Founder photo with credibility line will increase conversion vs no photo because human face increases trust.'
- 'Single CTA above fold will increase conversion vs multiple CTAs because decision paralysis hurts conversion.'
What to Do with Low Traffic
Option 1: Focus on User Research Instead
- 5–10 user interviews provide more signal than underpowered A/B tests
- Watch users navigate your landing page (UserTesting.com, screen sharing on Zoom)
- Identify confusion points, friction, missing information
- Iterate based on qualitative learning
Option 2: Aggregate Traffic Over Time
- Run a test for 8–12 weeks if needed
- Acceptable for high-impact tests
- Not practical for many tests, but works for big bets
Option 3: Skip A/B Testing Temporarily
- Focus on growth that doesn't require statistical rigor first
- Improve content, distribution, product
- Return to A/B testing when traffic supports it
Common A/B Testing Mistakes
- Testing trivial things — Button colors, minor copy. Test impactful things.
- Insufficient sample size — Running tests on 200 visitors and calling winners.
- Peeking and stopping early — When variant looks ahead. Run to planned sample size.
- Testing multiple variables at once — Can't isolate cause. Change one thing per test.
- No clear hypothesis — Testing without theory. Force yourself to articulate the hypothesis.
- Treating qualitative as inferior — User research often beats underpowered A/B tests.
- Ignoring statistical significance — Calling 5% lift on 200 samples a 'win.'
- Running too many tests at once — Test pollution. One major test at a time.
- Not documenting results — Same tests get repeated. Build institutional memory.
- Acting on partial wins — Variant is 'ahead' but not statistically significant.
- Testing the same thing repeatedly — Once you've tested X, take the learning and move to Y.
- Ignoring segments — Variant may win overall but lose in specific segments.
Frequently Asked Questions
How much traffic do I need to A/B test?
Depends on baseline conversion rate and effect size you want to detect. For 5% baseline and 50% lift detection, ~1,200 visitors per variant (2,400 total). For smaller effects, more traffic. Calculate before running.
What if I can't reach statistical significance?
Several options: (1) Test larger effect changes only. (2) Aggregate traffic over months. (3) Use qualitative research instead. (4) Skip A/B testing and focus on other growth levers until traffic supports it. Don't run tests you can't power statistically.
How long should I run a test?
Until you reach the calculated sample size. Time isn't the criterion; sample size is. A test reaching sample size in 1 week is valid; same test that takes 8 weeks at lower traffic is also valid.
Can I A/B test paid traffic landing pages?
Yes — often easier because traffic is more predictable. Run paid ads to two URLs; compare conversion. Paid traffic isolates from organic variability.
What about Bayesian vs Frequentist A/B testing?
Most indie SaaS use frequentist (the traditional p-value approach). Bayesian (used by GrowthBook by default) provides probabilities and can be more intuitive. Pick one and stick with it; consistency matters more than method choice at indie scale.
Most landing page A/B tests fail because indie SaaS founders test trivial changes at insufficient traffic. Test impactful things at sufficient scale. What to test: headlines, value propositions, target audience callouts, CTAs, pricing presentation, hero visuals, social proof placement. Statistical significance requires sample size. Tools for indie scale: PostHog feature flags, GrowthBook, Vercel Edge Config. The first test to run is your headline. Whatever wins becomes your new baseline. Each iteration produces incremental lifts that compound into significant conversion improvements over months. Start with impactful tests; build the muscle; let the results compound.
Got an idea? Build it now!
Just start with a simple Prompt
Get Started Today
Ready to be a
10x Marketer?
See it in action


